Project Overview
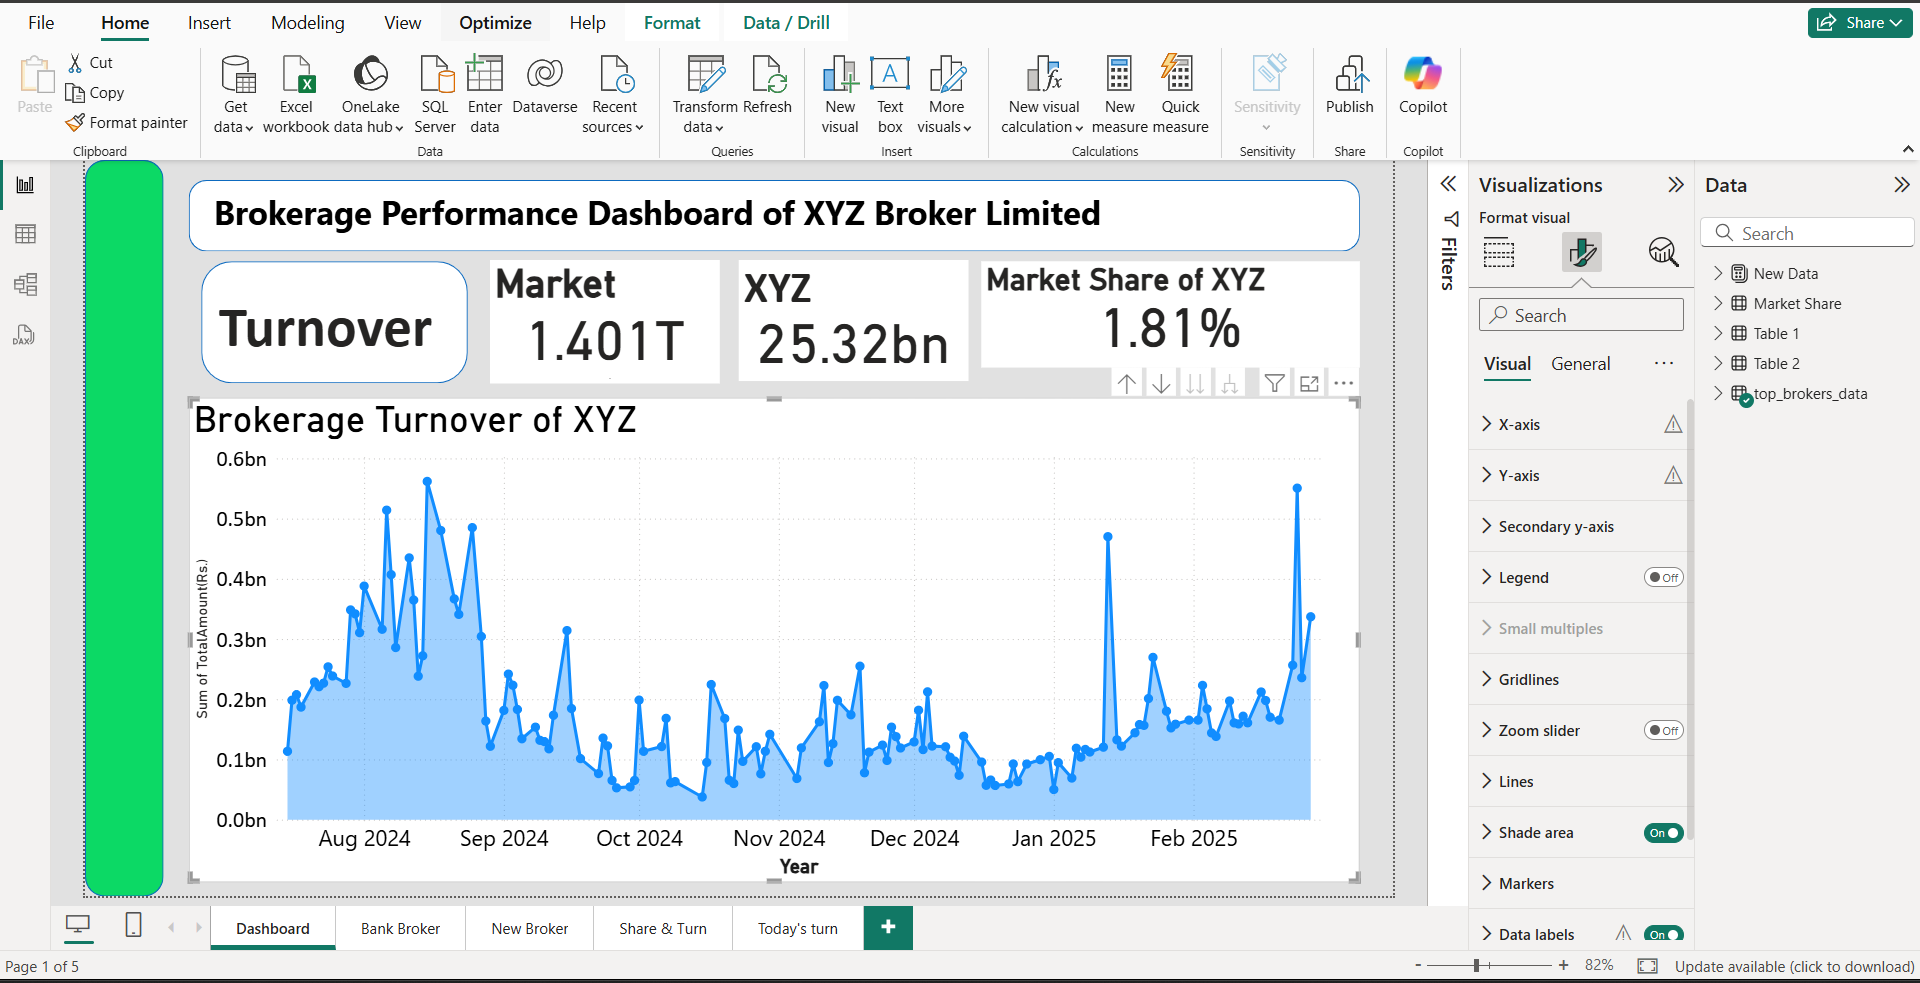
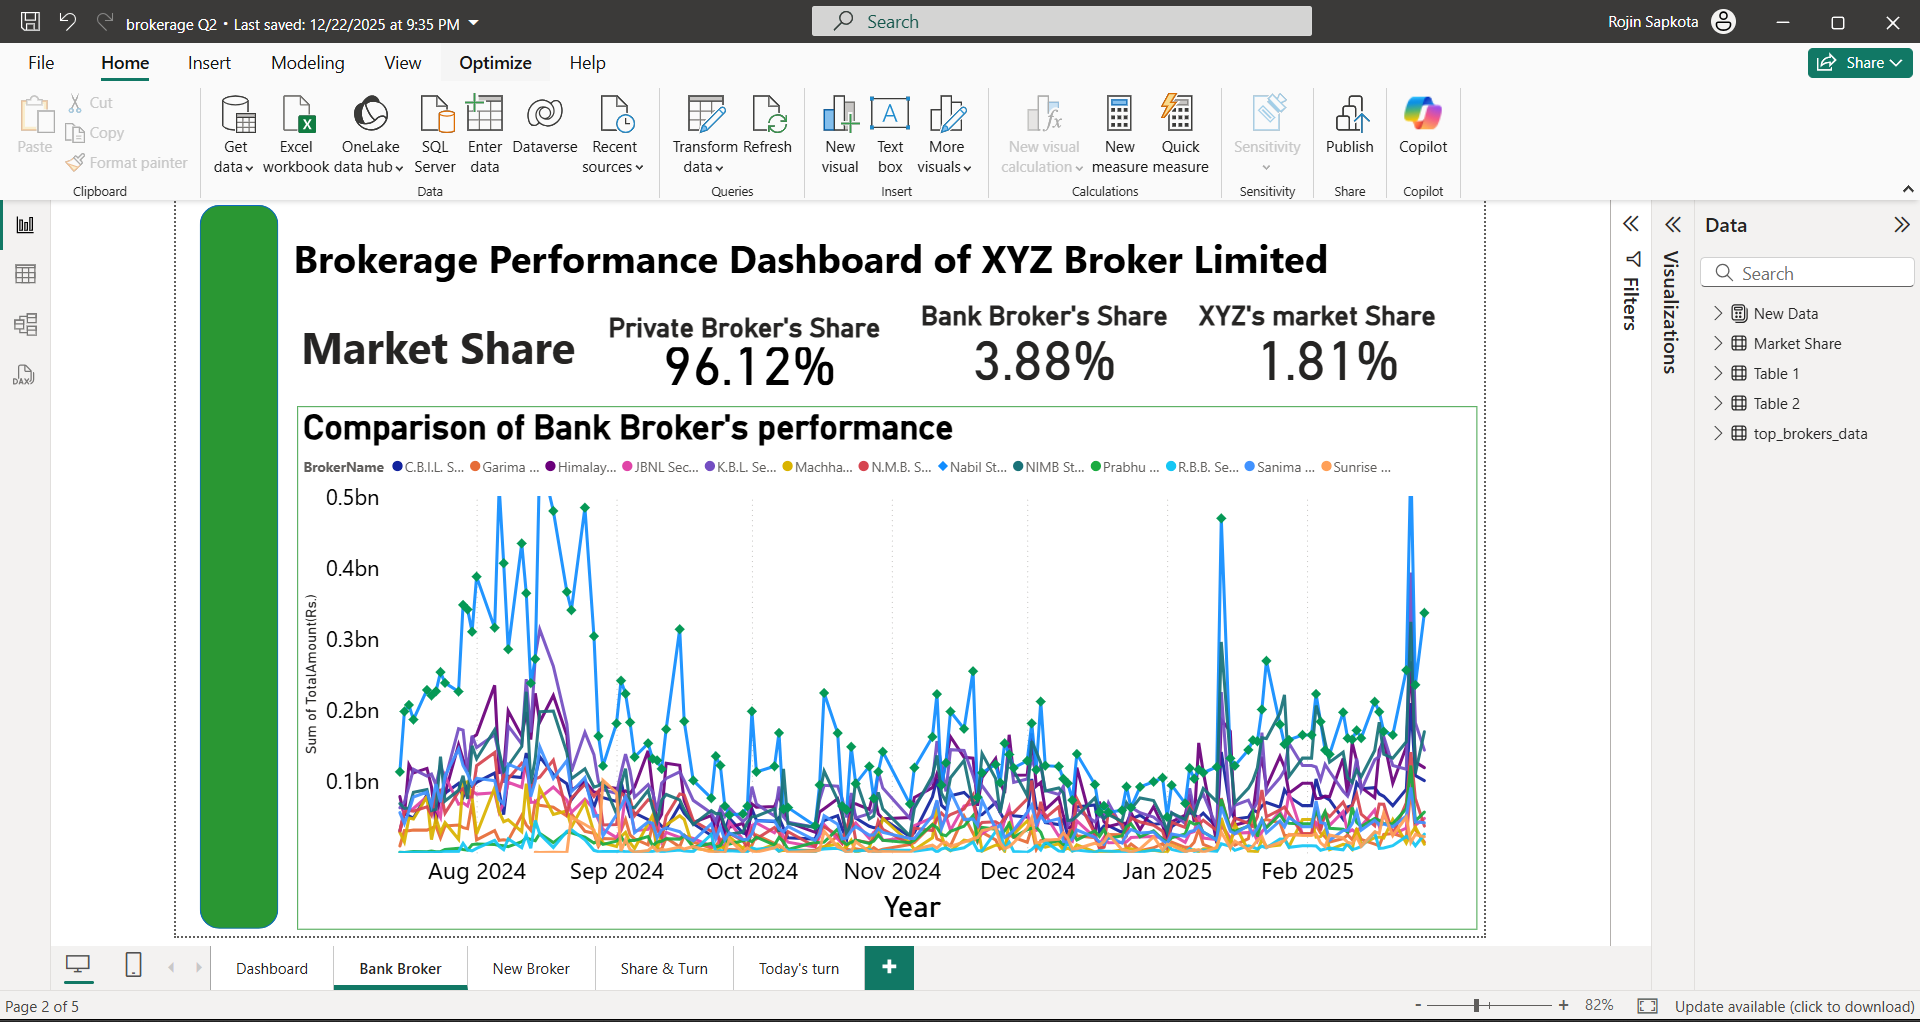
This project features an interactive Power BI dashboard that analyzes the daily turnover and performance of brokerage firms in Nepal.
Data Period: August 2024 – February 2025
Source: Public data from sharesansar.com/top-brokers
Dataset: Daily turnover records for 92 brokerage firms
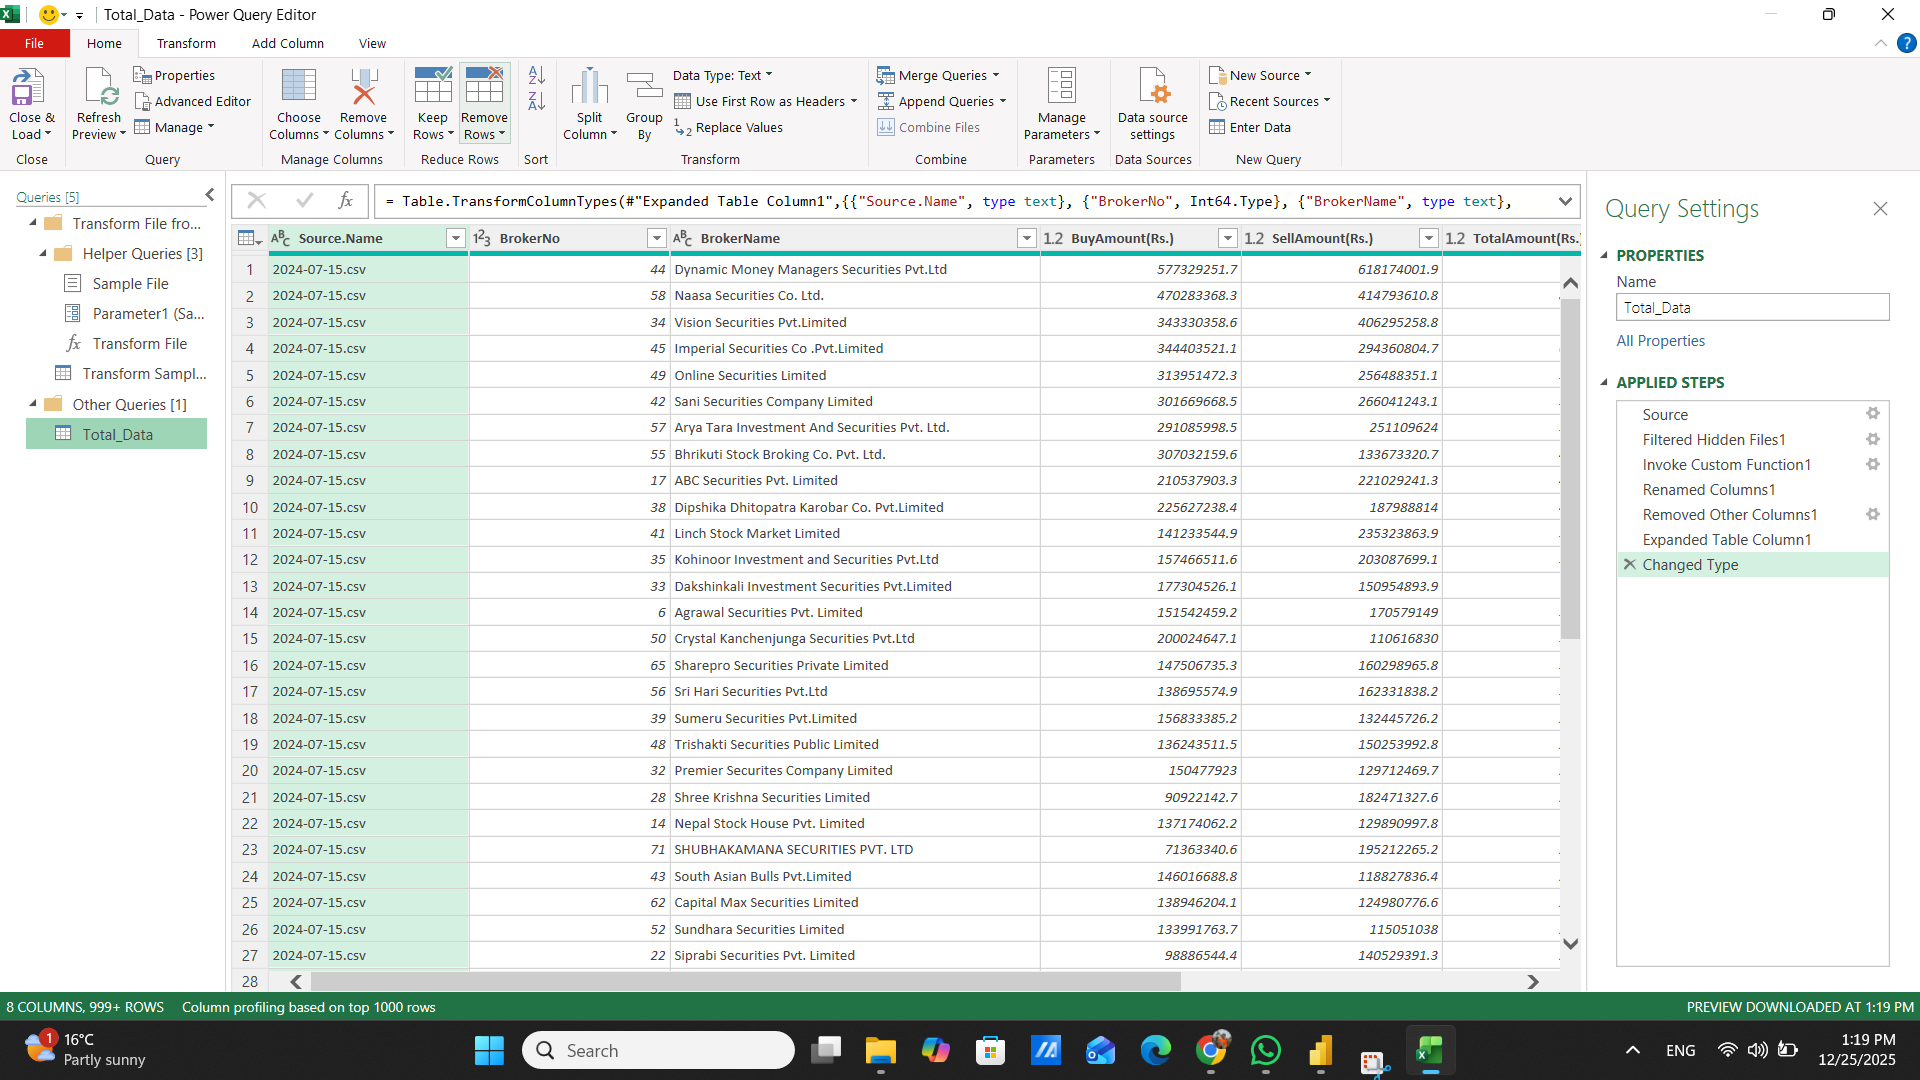
Multiple CSV files were downloaded, consolidated, and cleaned in Excel using Power Query. Firms were categorized by licensing status ("newly licensed") and ownership type (Banking/Financial Institution-owned or individual-owned). Relationships were built in the data model for cross-category analysis.
The cleaned dataset was imported into Power BI, where custom DAX measures were created for calculations. The final dashboard includes:
- Overall performance overview
- Sub-category comparisons
- Rankings and positional changes over time
- Directional trend indicators
Important Note: For demonstration and practice purposes only, all brokerage firm names have been replaced with placeholders such as "XYZ". This project is a sample created solely to showcase skills in data extraction, transformation, modeling, and visualization. It has no affiliation with any actual brokerage firm.
Download Sample Daily Brokerage Report (PDF)
Project Screenshots